
Comment démarrer avec l'API - Optimiser les composants dans un assemblage 04
Premiers pas
Nous recommandons de suivre le tutoriel Comment démarrer avec l'API - Bases 01, qui vous présente l'API et la configuration de l'environnement.
Fichier d'assemblage
Cet exemple est basé sur des fichiers créés dans le tutoriel Comment démarrer avec l'API - Importer un modèle et lancer un calcul 03.
Veuillez télécharger le fichier tutorial 03 with template-new.ideaCon.
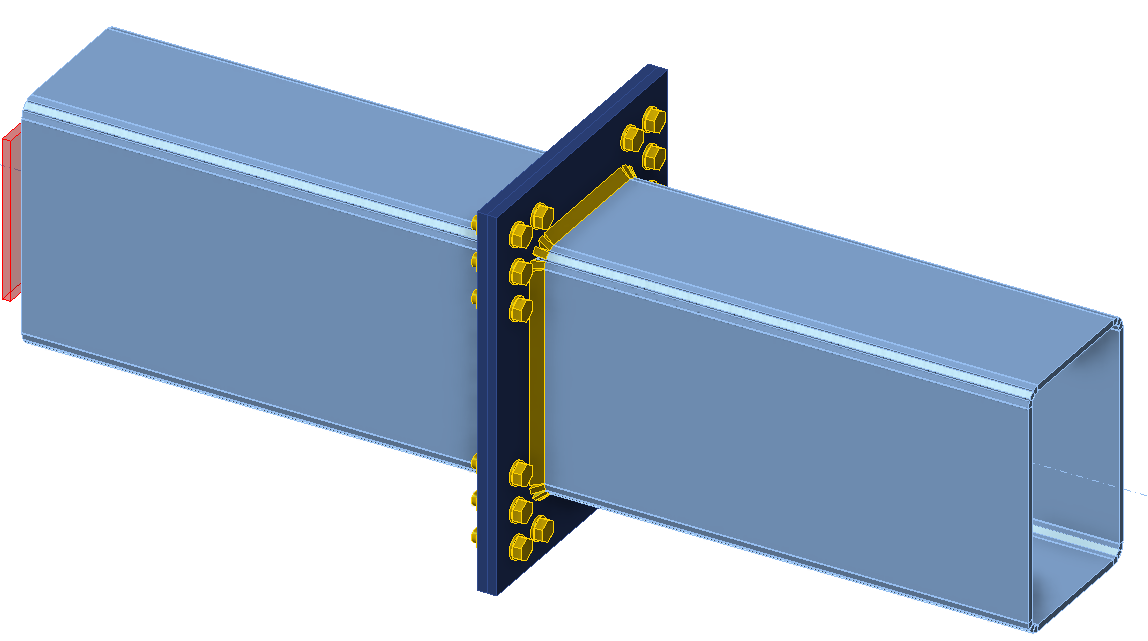
Nous souhaitons optimiser les composants de l'assemblage (soudures, diamètre et nombre de boulons). Le résultat de l'optimisation correspond aux coûts de l'assemblage, présentés de manière claire sous forme de graphique.
Client Python
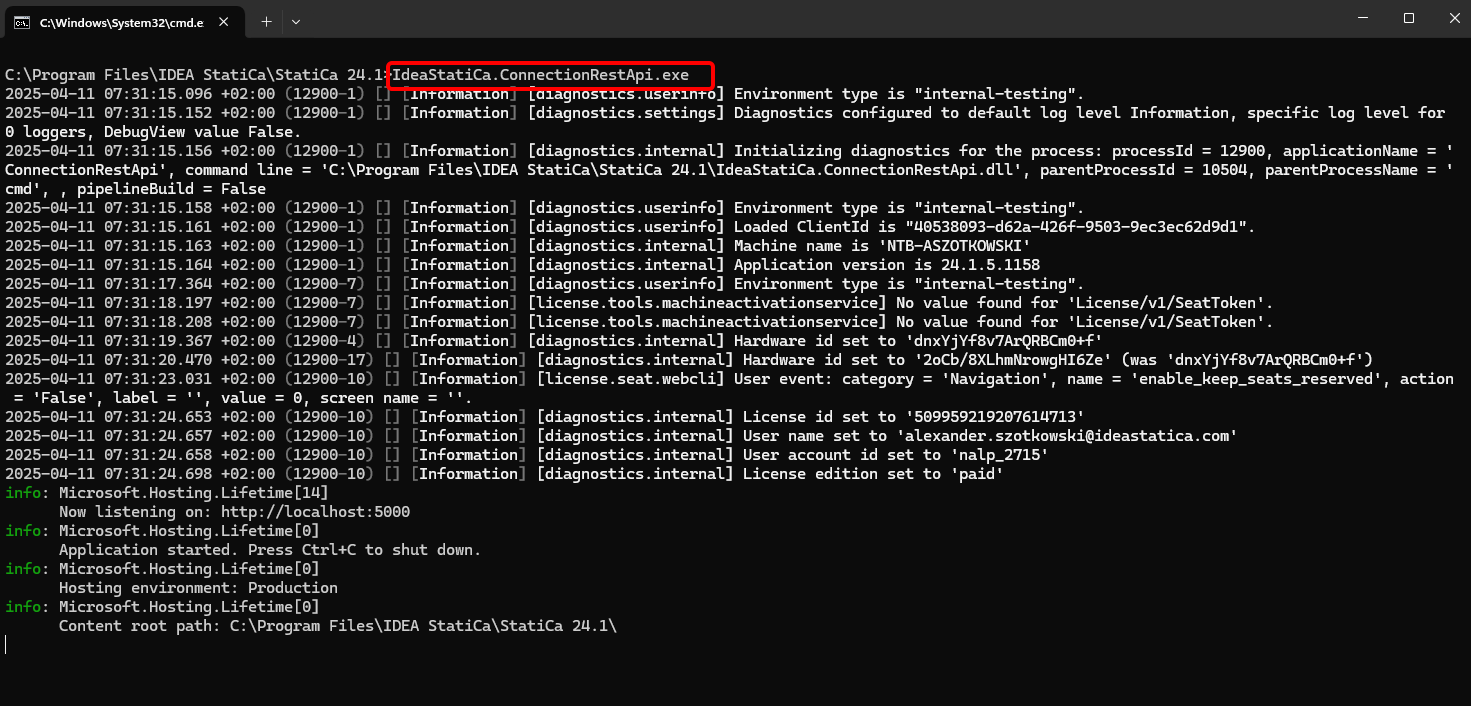
Exécutez "IdeaStatiCa.ConnectionRestApi.exe" dans CMD depuis le dossier IDEA StatiCa approprié et ouvrez l'outil IDE de votre choix.
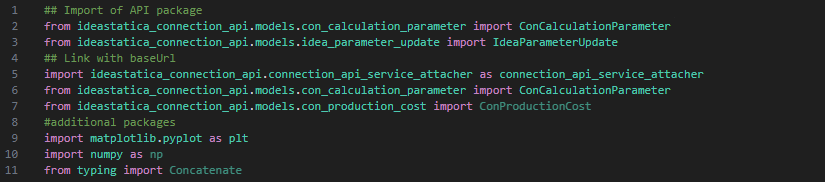
- Créez un nouveau fichier et importez les packages qui permettront d'utiliser le calcul et d'établir le lien avec l'URL localhost.
Code source :
## Import of API package
from ideastatica_connection_api.models.con_calculation_parameter import ConCalculationParameter
## Link with baseUrl
import ideastatica_connection_api.connection_api_service_attacher as connection_api_service_attacher
from ideastatica_connection_api.models.con_calculation_parameter import ConCalculationParameterfrom ideastatica_connection_api.models.con_production_cost import ConProductionCost
#additional packages
import matplotlib.pyplot as plt
import numpy as np
from typing import Concatenate
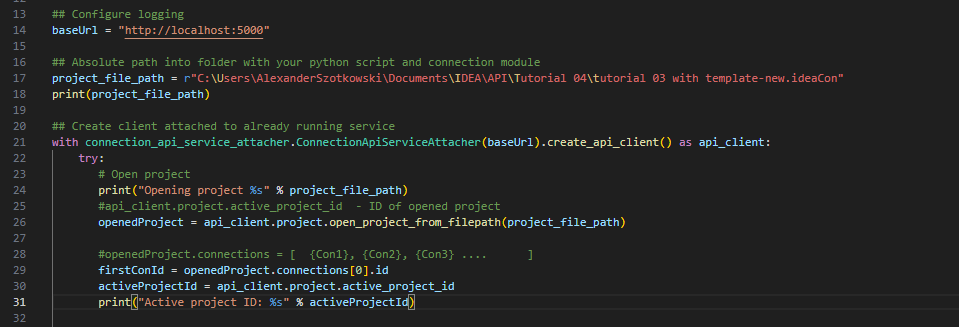
- Configurez la journalisation via la variable "baseUrl", qui appellera votre localhost. Dans la deuxième étape, associez le chemin absolu de votre fichier IDEA StatiCa Connection.
## Configure logging
baseUrl = "http://localhost:5000"
## Absolute path into folder with your python script and connection module
project_file_path = r"C:\Users\AlexanderSzotkowski\Documents\IDEA\API\Tutorial 04\tutorial 03 with template -new.ideaCon"
print(project_file_path)
- Associez le client à un service déjà en cours d'exécution. Utilisez le bloc try/except - si le bloc try génère une erreur, le bloc except sera exécuté. Dans un premier temps, il est nécessaire d'ouvrir le projet et de trouver l'ID de projet de votre projet, qui est unique pour chaque projet IDEA StatiCa. Nous sélectionnons ensuite le premier assemblage stocké dans notre fichier.
# Create a client attached to an already running service
with connection_api_service_attacher.ConnectionApiServiceAttacher(baseUrl).create_api_client() as api_client:
try:
# Open project
print("Opening project %s" % project_file_path)
#api_client.project.active_project_id - ID of opened project
openedProject = api_client.project.open_project_from_filepath(project_file_path)
#openedProject.connections = [ {Con1}, {Con2}, {Con3} .... ]
firstConId = openedProject.connections[0].id
activeProjectId = api_client.project.active_project_id
print("Active project ID: %s" % activeProjectId)
- Récupérez tous les paramètres nécessaires depuis le fichier ideaCon (nombre de boulons, diamètre, taille de soudure, assemblage boulonné)
#get parameters from ideaCon file
include_hidden = True
parameters = api_client.parameter.get_parameters(activeProjectId, firstConId, include_hidden=include_hidden)
#get default values from the ideaCon file
#Diameter of the bolt
boltParameter = parameters[3]
#print('bolt ',boltParameter.value)
#Number of bolt rows
rowParameter = parameters[11]
#print('row ',rowParameter.value)
#Weld size
weldParameter = parameters[28]
#print('weld ',weldParameter.value)
#Bolt assembly
boltAssemblyParameter = parameters[29]
#print('bolt assembly ',boltAssemblyParameter.value)
- Nous souhaitons obtenir des résultats uniquement lorsque le calcul est 100 % positif pour toutes les parties (plaques, soudures, boulons). Nous devons donc définir Arrêt à la déformation limite sur True. Les résultats seront stockés dans une liste appelée matrix, que nous utilisons ensuite pour afficher un graphique.
#setup
updateSettings = api_client.settings.get_settings(api_client.project.active_project_id)
from typing import Dict
updateSettings: Dict [str, object] = {
"calculationCommon/Analysis/AnalysisGeneral/Shared/StopAtLimitStrain@01" : True,
"calculationCommon/Checks/Shared/LimitPlasticStrain@01" : 0.05
}
api_client.settings.update_settings(api_client.project.active_project_id, updateSettings)
#Final results database
matrix = []

- Nous lançons maintenant un cycle en modifiant les soudures (de t = 8 à 5 mm), le diamètre des boulons (de M16 à M12) et le nombre de rangées (de 3 à 1). Les valeurs 8, M16 et 3 sont issues du fichier ideaCon. Les résultats en cours sont affichés à l'écran et ajoutés à la liste des résultats.
#cycling through welds with given rows and bolts
for row in range(rowParameter.value,1, -1):
#print ('Number of bolt rows is', row)
for bolt in range(int(1000*boltParameter.value), 12,-2):
for weld in range(int(1000*weldParameter.value), 5,-1):
par_row = IdeaParameterUpdate() # Create a new instance
par_row.key = rowParameter.key
par_row.expression = str(row)
par_bolt = IdeaParameterUpdate() # Create a new instance
par_bolt.key = boltParameter.key
par_bolt.expression = str(bolt/1000) # Decrement the expression
par_boltAssembly = IdeaParameterUpdate() # Create a new instance
par_boltAssembly.key = boltAssemblyParameter.key
par_boltAssembly.expression = str('M'+ str(bolt) + ' 8.8')
par_weld = IdeaParameterUpdate() # Create a new instance
par_weld.key = weldParameter.key
par_weld.expression = str(weld/1000) # Decrement the expression
updateResponse = api_client.parameter.update(activeProjectId, firstConId, [par_row, par_bolt, par_boltAssembly, par_weld] )
updateResponse.set_to_model
# Check if the parameters were updated successfully
if updateResponse.set_to_model == False:
print('Parameters failed: %s' % ', '.join(updateResponse.failed_validations))
#set the type of analysis
ConCalculationParameter.analysis_type = "stress_strain"
conParameter = ConCalculationParameter()
conParameter.connection_ids = [ firstConId ]
summary = api_client.calculation.calculate(activeProjectId, conParameter.connection_ids)
# Get results after calculation, store it in separate file and print the actual results
results = api_client.calculation.get_results(activeProjectId, conParameter.connection_ids)
CheckResSummary = results[0].check_res_summary
costs = api_client.connection.get_production_cost(api_client.project.active_project_id, firstConId)
api_client.project.download_project(activeProjectId, r'C:\Users\AlexanderSzotkowski\Documents\IDEA\API\Tutorial 04\tutorial 03 with template-updated.ideaCon')
if CheckResSummary[0].check_status == False:
break
if CheckResSummary[0].check_status == True:
print (row,'rows of', bolt, 'bolts', 'and weld size ',par_weld.expression,' results are OK. Costs: ', costs.total_estimated_cost)
values= [row, bolt,par_weld.expression,costs.total_estimated_cost]
#print(values)
matrix.append(values)
else:
print ('Iteration %i failed' % weld)
else:
print ('Iteration %i for weld failed' % weld)
else:
print ('Iteration %i for bolts failed' % bolt)
else:
print ('Iteration %i for rows failed' % row)

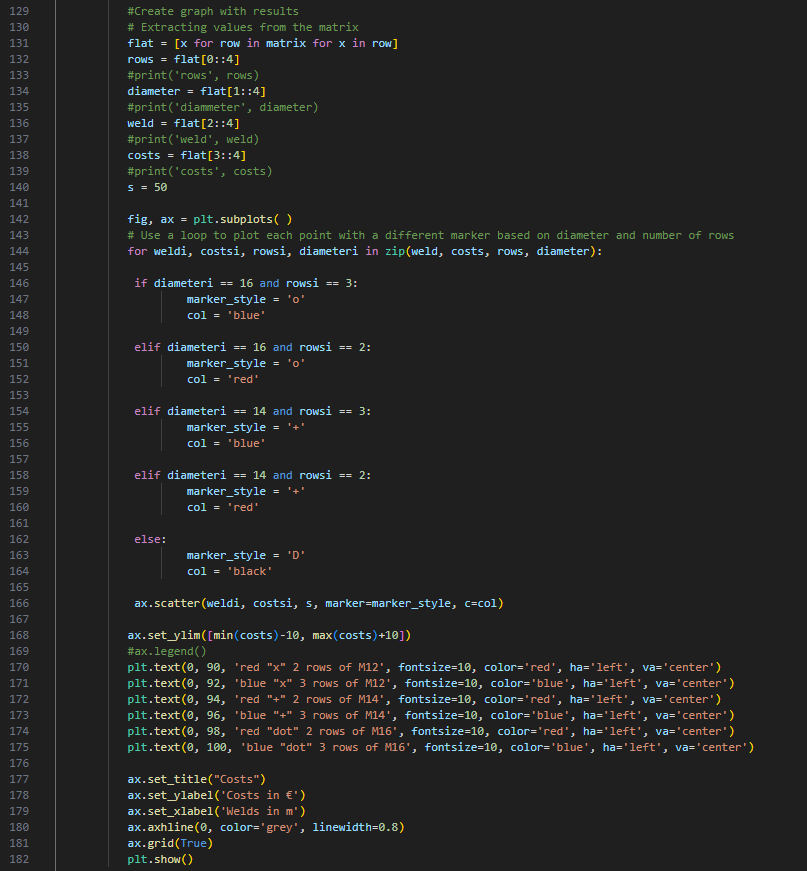
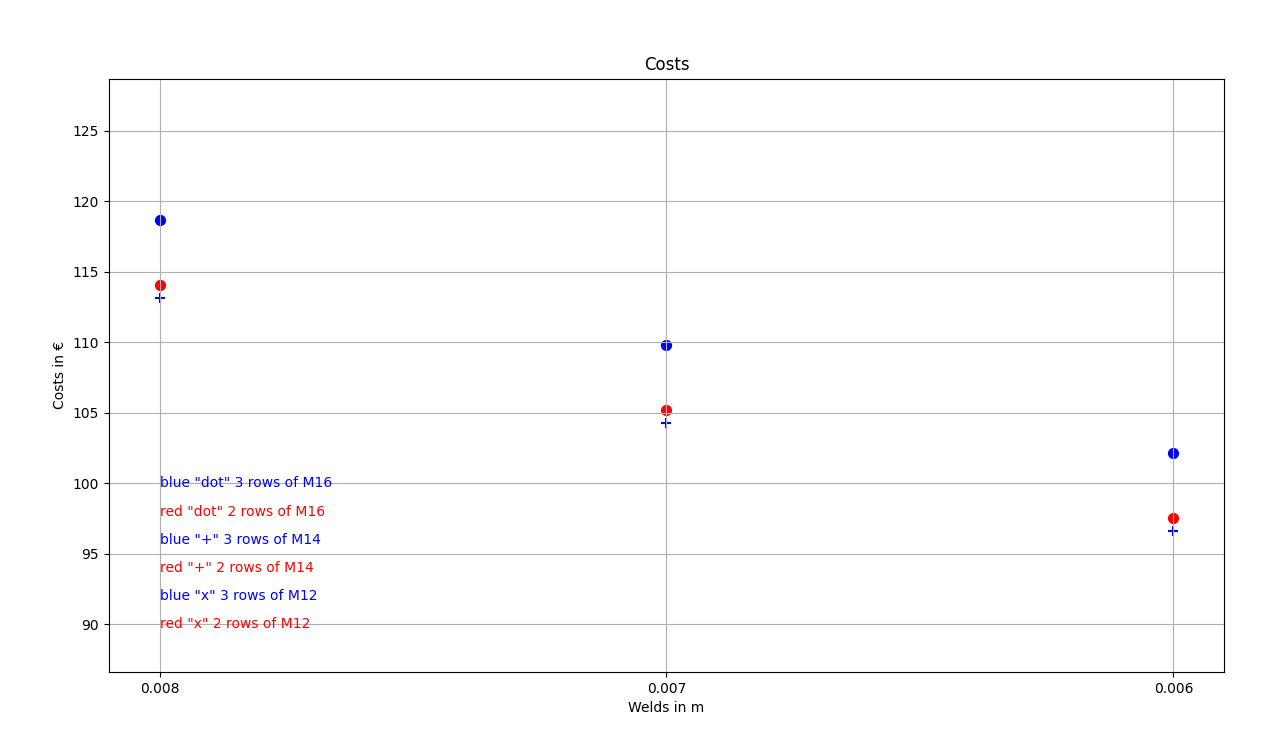
- La dernière partie concerne la création d'un graphique avec nos résultats.
#Create graph with results
# Extracting values from the matrix
flat = [x for row in matrix for x in row]
rows = flat[0::4]
#print('rows', rows)
diameter = flat[1::4]
#print('diammeter', diameter)
weld = flat[2::4]
#print('weld', weld)
costs = flat[3::4]
#print('costs', costs)
s = 50
fig, ax = plt.subplots( )
# Use a loop to plot each point with a different marker based on diameter and number of rows
for weldi, costsi, rowsi, diameteri in zip(weld, costs, rows, diameter):
if diameteri == 16 and rowsi == 3:
marker_style = 'o'
col = 'blue'
elif diameteri == 16 and rowsi == 2:
marker_style = 'o'
col = 'red'
elif diameteri == 14 and rowsi == 3:
marker_style = '+'
col = 'blue'
elif diameteri == 14 and rowsi == 2:
marker_style = '+'
col = 'red'
else:
marker_style = 'D'
col = 'black'
ax.scatter(weldi, costsi, s, marker=marker_style, c=col)
ax.set_ylim([min(costs)-10, max(costs)+10])
#ax.legend()
plt.text(0, 90, 'red "x" 2 rows of M12', fontsize=10, color='red', ha='left', va='center')
plt.text(0, 92, 'blue "x" 3 rows of M12', fontsize=10, color='blue', ha='left', va='center')
plt.text(0, 94, 'red "+" 2 rows of M14', fontsize=10, color='red', ha='left', va='center')
plt.text(0, 96, 'blue "+" 3 rows of M14', fontsize=10, color='blue', ha='left', va='center')
plt.text(0, 98, 'red "dot" 2 rows of M16', fontsize=10, color='red', ha='left', va='center')
plt.text(0, 100, 'blue "dot" 3 rows of M16', fontsize=10, color='blue', ha='left', va='center')
ax.set_title("Costs")
ax.set_ylabel('Costs in €')
ax.set_xlabel('Welds in m')
ax.axhline(0, color='grey', linewidth=0.8)
ax.grid(True)
plt.show()
Comme vous pouvez le constater, dans ce cas particulier, l'assemblage le plus économique est celui avec une soudure de 6 mm et trois rangées de boulons M14.
Téléchargements joints
- tutorial 04 - 3 optimize bolts and welds.py (PY, 9 kB)
- tutorial 03 with template-new.ideaCon (IDEACON, 59 kB)